
Facility Analytics & Reports
Every facility. Every key metric.One clear view.
Bring facility dashboards, maintenance performance, service delivery and resource consumption into one reporting view. With Power BI reporting in DreamzCMMS, see patterns, compare sites and focus your next decision.
Based on 200+ reviews on






Trusted By Global Brands Across The World
























Less report chasing. More informed decisions.
See what is working, where attention is needed and how performance changes across your facilities.
Award winning CMMS software
Recognition from software review platforms for value, ease of use, functionality and customer support.







Your facilities. Your priorities. One clear dashboard.
Bring the measures that matter to your buildings into one place. Review work status, completion and facility-level performance, then compare sites using the same reporting period. Move from a portfolio overview to the facility that needs attention without losing the operational context.
See the work completed. Find the work still waiting.
Track how planned and corrective maintenance is being delivered across your facilities. Review due and completed work, on-time preventive maintenance, outstanding jobs and recorded downtime. Use the trends to guide team discussions, scheduling decisions and follow-up work.
Measure the service, not just the number of requests.
Bring request volumes, response times, resolution progress and service targets into the same review. Compare categories and facilities to see where work is building up. Keep the discussion connected to your defined service rules and the job records behind each result.
Understand where your facility resources go.
Review electricity, water and other recorded resource use alongside maintenance activity. Bring labor hours and parts consumption into the picture where those records are available. Compare like-for-like periods and facilities to identify unusual usage and plan a closer investigation.
Bring Power BI into your facility reporting.
Use Power BI reporting with DreamzCMMS to bring maintenance, service delivery and resource measures into focused management views. Shape reports around the questions your team needs to answer, compare performance across facilities and keep reviews connected to the available operational data.
Bring your facility reporting priorities to the demo
Start with the dashboards, KPIs and management reports your team needs to review.
Go from the number to the work behind it.
Use VEDA to find maintenance history, review outstanding work and bring asset context into the conversation. Ask everyday questions about recorded facility activity, review the supporting information and prepare the next action with your team.
Start with Logistics Hub.
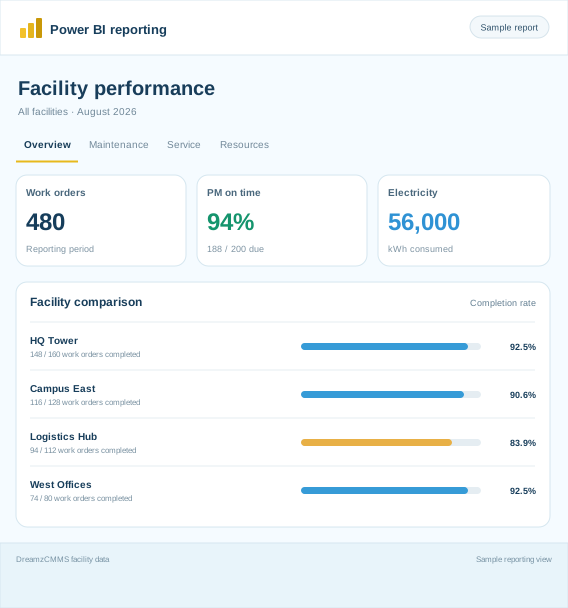
The sample August report shows 18 outstanding work orders here: 8 in progress and 10 open.
See the report. Ask about the record.
Combine facility reporting with the maintenance context your team needs to decide what happens next.
The site, the service and the resources. Connected.
Facility dashboards
Keep site-level performance and portfolio summaries in view.
Maintenance KPIs
Review due, completed and outstanding maintenance work.
Service performance
Understand response, resolution and target performance.
Resource consumption
Review recorded energy, water, labor and material use.
Site comparisons
Compare facilities using consistent periods and measures.
Power BI reporting
Bring key measures into focused facility and management reports.
Record-level context
Connect the result with the maintenance or service record behind it.
VEDA AI context
Ask about asset history and outstanding maintenance work.
Keep facility reporting close to the operation.
Use dashboards with DreamzCMMS facility, asset, work-order and service workflows. Include resource and enterprise data through the sources and integrations configured for your reporting needs.
Integrations
- SAP
- Sage Intacct
- Stripe
- Zebra
- CIMCON
- Oracle NetSuite
- Intuit QuickBooks
- Propelr
- Microsoft Dynamics 365
- Xero
- Razorpay
- Samsara
- Odoo
- TallyPrime
- RevRex
- PhonePe
- Chainway
- CardConnect
- Codat
- Siesa
- Unleashed
- Shopify
- Monnit
- Birdeye
- SAP
- Oracle NetSuite
- Microsoft Dynamics 365
- Odoo
- Sage Intacct
- Intuit QuickBooks
- Xero
- TallyPrime
- RevRex
- Stripe
- Propelr
- Razorpay
- PhonePe
- CardConnect
- Codat
- Zebra
- Chainway
- CIMCON
- Samsara
- Monnit
- Siesa
- Unleashed
- Shopify
- Birdeye
One view from the site to the decision.
Keep dashboards connected to the facilities, assets, services and resource records they describe.
One reporting approach across buildings and sites.
Commercial buildings
Review building maintenance, service requests and resource consumption across offices and shared facilities.
Hospitality
Compare maintenance and service delivery across properties, building systems and operational areas.
Healthcare facilities
Keep facility maintenance status, service performance and recorded resource use available for operational review.
Education & campuses
Bring campus buildings, shared services and multi-site reporting into a consistent performance view.
Give each team the context to act.
Facility managers
Review the facility dashboard, identify outstanding work and focus the next conversation on the areas needing attention.
Maintenance & service teams
Track workload, planned maintenance and service performance with the operational records needed for follow-up.
Finance & leadership
Bring resource use, maintenance costs and site comparisons into management reviews through focused reports and Power BI.




Answers for facility and reporting teams.
What are Facility Analytics & Reports?
They bring facility-specific dashboards, maintenance performance, service delivery and resource consumption into a connected reporting view. DreamzCMMS helps facility teams review operational measures and use Power BI reporting for their management reporting needs.
What can a facility dashboard show?
A facility dashboard can bring together work-order volumes, completed and outstanding work, planned maintenance and service activity. The measures and views should reflect the facilities, data and reporting priorities configured for your team.
How can we measure maintenance performance?
Review due and completed work, preventive maintenance completed on time, outstanding jobs and recorded downtime or costs. Define the reporting period and measure consistently so comparisons between facilities and time periods are meaningful.
Can we review service delivery and service targets?
Use request volumes, response and resolution times, outstanding requests and service-target performance to review delivery. These measures depend on the service rules, target definitions and timestamps captured in your workflow.
What resource consumption can we report on?
Review electricity, water and other recorded consumption where the relevant data is available. Labor hours and parts usage can add operational context. Meter, building-system or external source data needs an appropriate data connection or recording process.
How does Power BI fit into facility reporting?
Power BI reporting can bring facility, maintenance, service and resource measures into focused management views alongside DreamzCMMS. The available reports, data connections, access and refresh frequency depend on your agreed reporting configuration.
Can we compare multiple facilities?
Yes. Use facility and portfolio reporting to review sites over consistent time periods. Keep the definitions and available data comparable, and account for differences such as building size or operating hours when interpreting the results.
Are the dashboards always updated in real time?
Update timing depends on how source records are captured and how each report is configured. Operational views and Power BI reports may use different refresh arrangements. Confirm the required update frequency when planning your reporting setup.
How does VEDA help with facility analytics?
VEDA helps users find asset and maintenance history, review outstanding work and prepare work orders using normal-language requests. Use that context alongside your reports, and verify source records and proposed actions before making decisions.
How do we get started with facility reporting?
Start with your facility list, key performance questions and one current report. Identify the work-order, service and consumption data you already record, then use the demo to map the dashboard views, measures and Power BI reporting your team needs.