 BACK TO Blog
Asset Rental Management
Uncategorized
Asset Lifecycle Management KPIs: Essential Metrics to Track
- July 14, 2026
- DreamzCMMS Team
- 12 minutes read
- July 14, 2026
- DreamzCMMS Team
- 12 minutes read
These Asset Lifecycle Management KPIs are the numbers that will help you keep your physical assets (fleet vehicles, HVAC systems, production equipment, rental machinery, facility infrastructure) running optimally and ensure that your strategy is not based on “keep it running” (a.k.a. “reaction”) but on actual data and decision making.
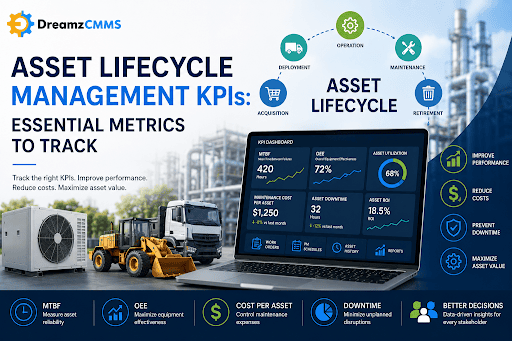
For now I would like to emphasize that we will talk about the 9 EAM KPIs you have to track, and where you already track them. Then I will go through each EAM KPI to explain what you can do with it, why you would track it and what the numbers mean. The 9 KPIs will give you a solid physical asset dashboard that will save you a lot of money in the long run by keeping more of your physical assets running longer.
Why Asset Lifecycle Management Metrics Deserve a Seat at the Table
All physical assets go through a number of different states or phases during their lifecycle. In Asset Lifecycle Management (EAM) we track assets throughout their lifecycle or through all of the different states that an asset goes through. These states or phases include: acquisition, deployment, operation, maintenance, retirement or disposal.
Many organizations utilize tracking of their physical assets throughout their lifecycle for many benefits. The most notable benefit is the earlier identification of decline in an asset’s performance. By identifying decline earlier in an asset’s lifecycle, an organization is able to determine if it is best to perform maintenance on the asset or to replace the asset with new one prior to total failure. In either case, the organization is able to save a significant amount of money and prevent what is known as unexpected downtime.
In addition to these benefits, organizations can better create a budget to maintain the assets that they utilize on a regular basis. This will allow the organization to plan for required repairs in advance rather than waiting until the last minute and incurring additional expenses as a result of any needed repairs being considered as an emergency. More information regarding the benefits of asset lifecycle tracking can be found by reviewing the article titled Asset Lifecycle Tracking Benefits.
In short, what you measure is what you can manage. And by managing assets during their lifecycle, they will last longer and cost less to own and maintain.
The Core EAM KPIs to Track Across the Asset Lifecycle
When tracking the performance of physical assets, dozens of metrics and EAM KPIs can be used to assess their performance. Below are the 9 core EAM KPIs to track for physical assets across their lifecycle.
Mean Time Between Failures (MTBF): Asset Performance Indicator. MTBF indicates how reliable your assets are. MTBF is the average time an asset is operating between failures. In essence it measures how long an asset can operate before it fails. In a positive sense an increase in the MTBF indicates that your maintenance strategy is effective. In a negative sense a decrease in the MTBF will indicate that your assets are failing due to wear, misuse or poor quality of parts. This should prompt you to check for any impending failures. MTBF for different asset classes should be measured separately to find out which of the asset types are negatively affecting the overall MTBF.
OEE - Overall Equipment Effectiveness: OEE measures how effective an asset is producing at its maximum theoretical output. Like MTBF, this metric can show why an asset is underperforming and, in contrast to MTBF, why an asset that is in operation is not performing well.
Asset ROI Tracking : Calculate the Return on Investment of Your Assets. This KPI will allow you to track the cost of acquiring an asset as well as the cost of maintaining it. Then you will be able to compare the output or return on investment that the asset is producing to the total cost. The result will allow you to make an informed decision regarding whether to repair or replace an asset.
Asset Utilization : The Measure of how Productive your Assets are Being Used. Whether you own your assets or lease them, there are certain metrics that can be used to track the productive use of your rental equipment. Whether your assets are being used enough is a question that should be taken seriously. The key for your business is to understand the amount of money that each of your assets are being used and then compare that against other assets to see if there are any that are being underutilized.
As mentioned before, underutilized assets are costing a lot of money to maintain. Therefore, a company needs to investigate whether or not they are over-invested in a particular class of assets. If they find that they are, they can start to search for more cost-effective solutions. For those of you who offer your assets for lease, this metric can also help measure the amount of idle time your technicians spend waiting for parts to be fixed. This is a major cost for rental-based fleets, and a metric to track it is invaluable.
Read more about the specific Utilization metrics that can be used to measure the performance of rental assets in Key Metrics for Rental Asset Performance.
Asset Turnover Rate KPI: This is another one of the preferred finance KPIs as it links the performance of your assets with the value on the balance sheet and calculates how efficiently your assets are generating revenue in relation to their book value.
Maintenance Cost Per Asset : It is a simple number but it has a lot of influence. If the maintenance cost per asset is increasing in a steeper rate than the decrease in the output or utilization of the asset then it is time to start looking for a replacement asset that will save you money in the long run of the asset’s life.
Asset Availability Metrics: Measures the percentage of time scheduled for an asset that it is actually available to work (planned downtime plus unplanned downtime).
Asset Downtime KPIs: There is a difference between planned and unplanned downtime. Both types of downtime are bad for any asset but planned downtime is typically easier to manage then unplanned downtime. So it is good to track the amount of time an asset is down and divide this between planned and unplanned downtime. This will help to focus efforts on reducing the amount of time spent dealing with unforeseen problems that require immediate attention and indicate when the maintenance is being done more proactively or reactively.
Maintenance Efficiency Metrics: These indicators evaluate your maintenance team’s performance by providing measurements on their efficiency in executing work as scheduled, promptly, and achieving the desired outcome of a work order. Most lifecycle programs that are “high performing” have a very solid set of maintenance execution metrics.
Most of these numbers already exist somewhere in your operation — in work orders, technician logs, and purchase records. The challenge is usually consolidation, not collection. That's where dedicated asset maintenance management software earns its keep, pulling scattered data into KPIs your team can actually act on instead of numbers buried in a dozen spreadsheets.
These EAM KPIs to track already exist within experienced teams and form part of the work done within existing software, in the form of reporting, dashboards etc. and simply can be collated and tracked to help give a clear indication to the team of data in order to continually improve, by aggregating from data from work orders, PM schedules, maintenance logs, purchase orders and other areas within the EAM system. For more information around KPIs relating to the maintenance execution process, see Key Performance Indicators for Maintenance.
Note that there are two types of indicators: those that report out two sides of the same coin (i.e. failures) and those that report out other types of data. Downtime KPIs are examples of the first type of indicator. The maintenance cost per asset number has meaning only in the context of the various utilization indicators (i.e. the returns that can be had from the other asset classes). As such, various asset performance indicators are most useful when looked at in groups of 2 or 3 (i.e. OEE, MTBF and the lifecycle cost of the various assets of that class). This will allow one to not only look at the metrics for a given class of assets but also to understand why a given metric is where it is.
Leading and Lagging Indicators. Most indicators are either leading or lagging. Downtime and ROI are typical examples of lagging indicators because they describe past performance. MTBF and its trend, as well as the values of the maintenance KPIs and early changes in the OEE are typical examples of leading indicators. They forecast future performance and allow time to act before negative costs arise.
Lifecycle Cost Metrics: What They Reveal About Long-Term Asset Value
The purchase price of an asset is typically the lowest single cost element of the total lifecycle cost of ownership of that equipment. So, when comparing similar rental or lease equipment, the purchase price is not necessarily the best method to compare the true cost of ownership.
Asset lifecycle cost metrics can reveal surprises. For example, although an inexpensive asset may seem the best choice at first, after detailed investigation into costs of failure, etc. for example it could actually have higher maintenance costs than other alternatives. As a result, it is important to collect and track many of the various lifecycle cost metrics for all of your assets.
During budgeting time, the results of these metrics can be used to counteract the typical purchasing practice of awarding the lowest bid. In reality, such purchasing can actually cost 5 times as much over the useful life of an asset as the cost of a higher-priced piece of equipment that would have been much more reliable. In many cases, the initial extra cost is offset by lower costs of operation over time. Typical threshold values for trigger points to replace an asset rather than repair it are already embedded in the structured process for making such a decision for assets, as described in the Best Practices for Asset Lifecycle Management.
Build an Asset Management KPI Dashboard That Actually Gets Used
Having many good KPIs does not automatically result in a good asset management KPI dashboard. The problem are to many metrics, nobody takes care of the dashboard and already after the first month of creation of the dashboard the numbers are not looked at anymore.
Begin with a few key metrics that apply to your current challenges. For example, if you are dealing with a lot of unplanned downtime, you may wish to track Downtime KPIs and MTBF trends in order to best understand and work with the root causes of the problems your facing. On the other hand, if budget is a primary challenge, then you would focus on your lifecycle cost metrics (such as ROI) as well as your maintenance cost per asset.
Ensure there is an owner of each metric to check on a regular basis. Work order metrics and those that are measuring downtime are best to check on a weekly basis. The other metrics are slowly changing and can be looked at on a monthly or quarterly basis to see trends.
Group your indicators for asset performance by asset type. An average OEE for all assets is most likely a mask for very poor performance of the worst type of assets. Allow the user to easily drill down to individual assets for detailed review in no more than 2 clicks.
Make your asset performance indicators accessible to all people in your organization who could potentially make decisions about your assets. Finance, operations and procurement will make better decisions if they can look at the same real-time data as the maintenance team rather than waiting for a quarterly report that is likely to be out of date by the time it arrives.
Define the “end point” or healthy indicator for every metric you track. Create a baseline from your data that you’ve collected in the first few months. Set up thresholds for your KPIs to signify “good” (monitor), “ok” (watch), and “bad” (immediately attend to). Use these for things like: Work order review, Replace or repair analysis, etc.
How DreamzCMMS Turns These KPIs Into Everyday Decisions
For companies that manage to track the lifecycle of a few assets manually, as the company grows to manage a fleet of assets spread across multiple sites, or a mix of owned and rented equipment, it quickly becomes impractical to track a set of KPIs manually.
Automate all your asset data, in real time! MTBF, OEE, Downtime, and more. View all your utilization and maintenance cost by asset metrics in real time on your dashboard. This is automatically pulled in real time from all your work orders, from all your technician logs, and from all your asset records. No more manual work to calculate and enter the many lifecycle cost metrics each quarter. A trend that is starting to increase in cost to you will surface automatically in real time, while it is still a scheduling item and not yet a breakdown!
DreamzCMMS has complete asset lifecycle management software. It will track your KPIs and at the same time it will manage your work orders, schedule your preventive maintenance and manage your assigned technicians to fix the problem and complete the work order in progress to move the numbers in the right direction of the increasing KPI numbers.
Asset Lifecycle Cost Metrics to Predict Breakdowns!
Asset lifecycle management KPIs for monitoring to predict failures such as increasing maintenance cost per asset, decreasing OEE values and others.
If you’re currently tracking your equipment’s data in spreadsheets, gathering information from various team members, or trying to piece together the correct information from your current software then a demo DreamzCMMS. Book a free demo of DreamzCMMS can show you how the software can turn your current data to start making decisions on the spot for the fixing of your assets.




Subscribe to Our Newsletter
 100% SECURE
 We Respect Your Privacy
 Ready for More?
Talk to one of our CMMS experts and see how DreamzCMMS can simplify your maintenance operations.
Book a free consultation