Facility Analytics & Reports FAQ
Answers for facility and reporting teams.
What are Facility Analytics & Reports?
They bring facility-specific dashboards, maintenance performance, service delivery and resource consumption into a connected reporting view. DreamzCMMS helps facility teams review operational measures and use Power BI reporting for their management reporting needs.
What can a facility dashboard show?
A facility dashboard can bring together work-order volumes, completed and outstanding work, planned maintenance and service activity. The measures and views should reflect the facilities, data and reporting priorities configured for your team.
How can we measure maintenance performance?
Review due and completed work, preventive maintenance completed on time, outstanding jobs and recorded downtime or costs. Define the reporting period and measure consistently so comparisons between facilities and time periods are meaningful.
Can we review service delivery and service targets?
Use request volumes, response and resolution times, outstanding requests and service-target performance to review delivery. These measures depend on the service rules, target definitions and timestamps captured in your workflow.
What resource consumption can we report on?
Review electricity, water and other recorded consumption where the relevant data is available. Labor hours and parts usage can add operational context. Meter, building-system or external source data needs an appropriate data connection or recording process.
How does Power BI fit into facility reporting?
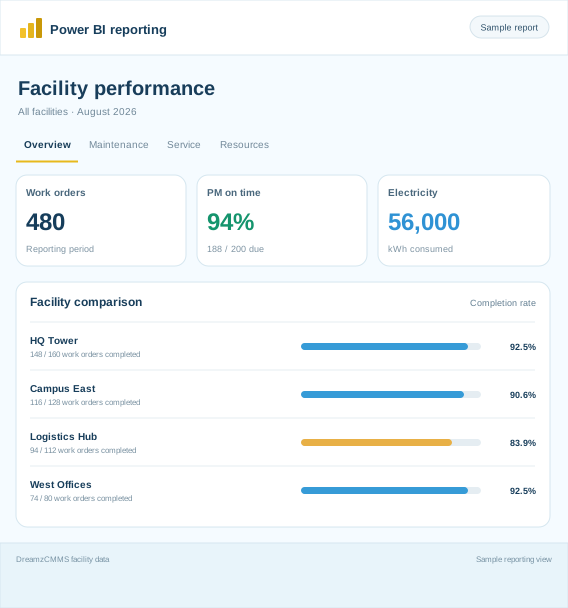
Power BI reporting can bring facility, maintenance, service and resource measures into focused management views alongside DreamzCMMS. The available reports, data connections, access and refresh frequency depend on your agreed reporting configuration.
Can we compare multiple facilities?
Yes. Use facility and portfolio reporting to review sites over consistent time periods. Keep the definitions and available data comparable, and account for differences such as building size or operating hours when interpreting the results.
Are the dashboards always updated in real time?
Update timing depends on how source records are captured and how each report is configured. Operational views and Power BI reports may use different refresh arrangements. Confirm the required update frequency when planning your reporting setup.
How does VEDA help with facility analytics?
VEDA helps users find asset and maintenance history, review outstanding work and prepare work orders using normal-language requests. Use that context alongside your reports, and verify source records and proposed actions before making decisions.
How do we get started with facility reporting?
Start with your facility list, key performance questions and one current report. Identify the work-order, service and consumption data you already record, then use the demo to map the dashboard views, measures and Power BI reporting your team needs.